Rainbow Chart Promises Bitcoin Rise to $409,000
According to the Bitcoin rainbow chart, by September 30, 2025, the rate of the first digital currency may fluctuate in a wide range from $36,596 to $409,412.
On the last day of summer, the price of the main cryptocurrency managed to rise above the resistance at $109,000, adding 0,4% over the last 24 hours and losing 4,4% over the week.
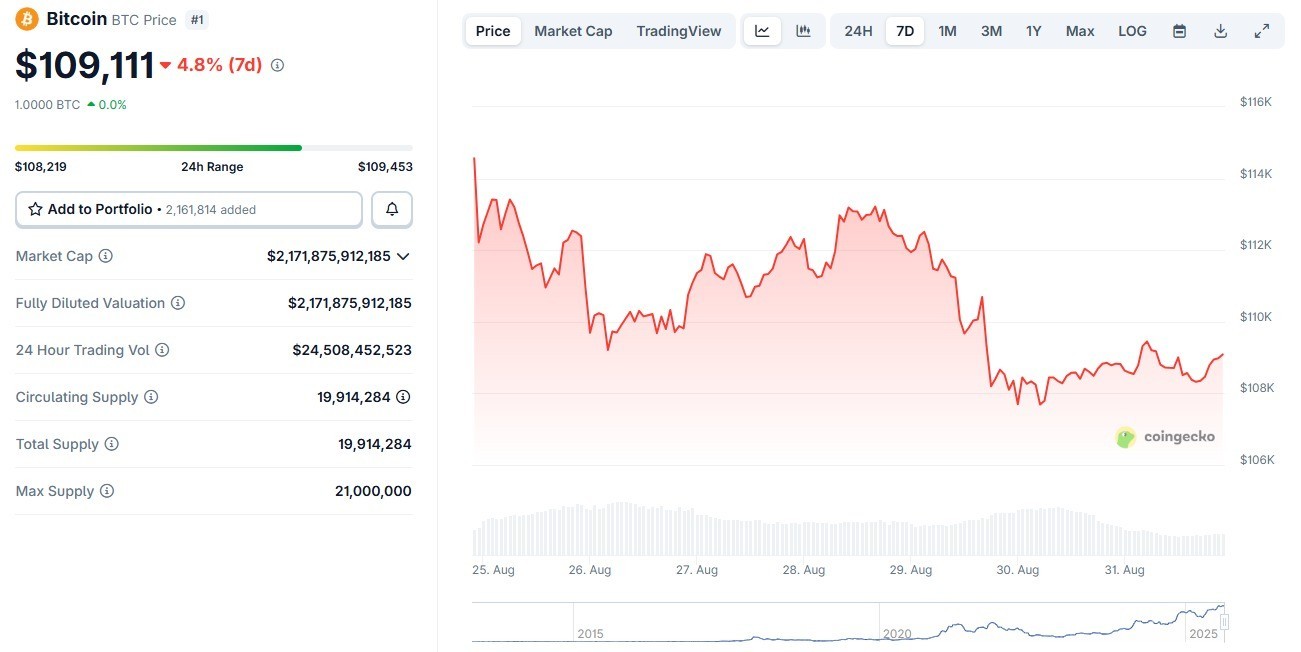
7-day Bitcoin price chart. Source: CoinGecko
The rainbow chart uses logarithmic regression to display Bitcoin’s historical price performance in colored bars, each representing a different sentiment phase.
At current prices Bitcoin is located at the lower boundary of the zone «HODL! «, which covers the range from $108,379 to $142,415. This suggests that if Bitcoin remains stable or rises slightly, it will likely remain in this zone until the end of September.
Historically, this zone reflects fair value, where long-term holders are encouraged to hold positions rather than make aggressive purchases or sales.
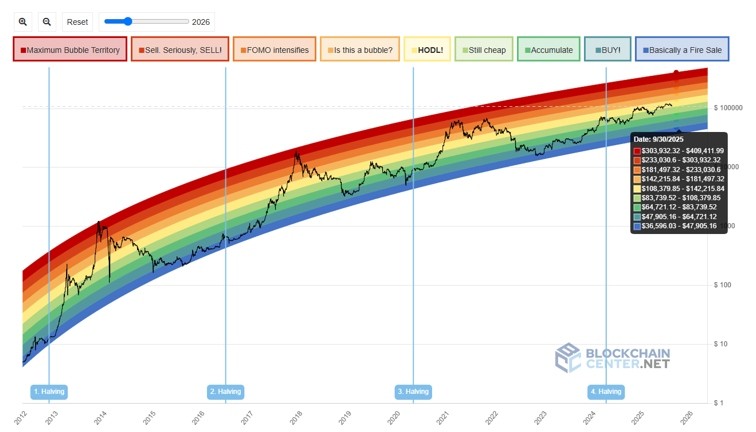
Bitcoin Rainbow Chart. Source: BlockhainCenter
Below, the “Basically a Sell-Off” zone signals extreme undervaluation between $36,596 and $47,905. Above it, the “Buy!” band covers the range from $47,905 to $64,791, followed by the green “Accumulate” zone from $64,791 to $83,759, which encourages long-term buying. The “Still Cheap” band covers the range from $83,759 to $108,379, which is just below Bitcoin’s current level.
The mid-range values include the “HODL!” zone ($108,379 to $142,415) and the yellow “Is It a Bubble?” range ($142,415 to $181,497). Above this level, speculative energy dominates in the orange “FOMO «is growing» ($181,497 to $233,030).
At the top of the «Sell. Seriously, SELL!» range, the range extends from $233,030 to $303,932, and «Maximum Bubble Territory» starts at $303,932 and ends at $409,41. These are levels historically associated with overheated markets and cycle peaks.
The rainbow chart is not a predictive model in the strict sense of the word, but it does provide context for Bitcoin’s price cycles compared to past bull and bear markets.